It’s true!
And of course was made by a bunch of CPAs, haha…
Per the AICPA (American Institute of CPAs):
The Personal Financial Satisfaction Index (PFSi) is a quarterly economic indicator from the AICPA which weighs a variety of economic factors to calculate the financial standing of a typical American.
The index is calculated as the difference between two component sub-indexes – the Personal Financial Pleasure Index and the Personal Financial Pain Index.
These sub-indexes are each composed of four equally weighted proprietary and public factors which measure the growth of assets and opportunities in the case of the Pleasure Index, and the erosion of assets and opportunities in the case of the Pain Index.
Positive scores of the PFSI indicate Americans are feeling personal financial pleasure, whereas negative scores indicate they are feeling personal financial plain.
After I almost spit out my coffee at all those “pleasure” remarks (hubba hubba!), I took the time to learn more about this intriguing PFSi and enjoyed it enough to want to fill your heads with it too ;)
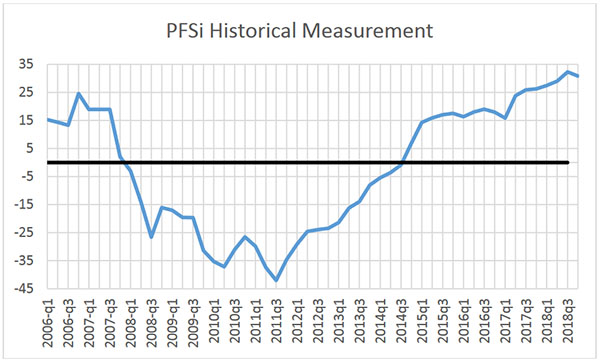
Basically it looks like financial satisfaction has been going pretty well lately for Americans, until something happened the last quarter of 2018 to lower it. I’m sure you could guess why.
Here are what the last 5 quarters looked like to give you an idea of the scoring:
| Quarter | PFSi | Personal Financial Pleasure | Personal Financial Pain |
| 2018 Q4 | 30.9 | 70.2 | 39.3 |
| 2018 Q3 | 32.3 | 74.2 | 42.0 |
| 2018 Q2 | 29.0 | 72.0 | 43.0 |
| 2018 Q1 | 27.5 | 59.5 | 42.0 |
| 2017 Q4 | 26.3 | 69.3 | 43.0 |
And then here’s a quick summary of what changed this last quarter (Q4, 2018) per the AICPA compared to the previous ones:
- 5 quarters of consecutive record highs & 7 quarters of financial satisfaction gains ended
- Stock market volatility impacts gains – market index no longer leading contributor to financial pleasure for first time in almost a decade
- Job openings now the largest contributor to financial pleasure for the first time in more than 8 years
You can view their latest press release for more info, but I warn you it’s what got me down this rabbit hole to begin with ;) –> Financial Satisfaction Drops for the First Time in 2 Years
And for you visual folks out there, here’s a fun Pleasure vs Pain history chart:
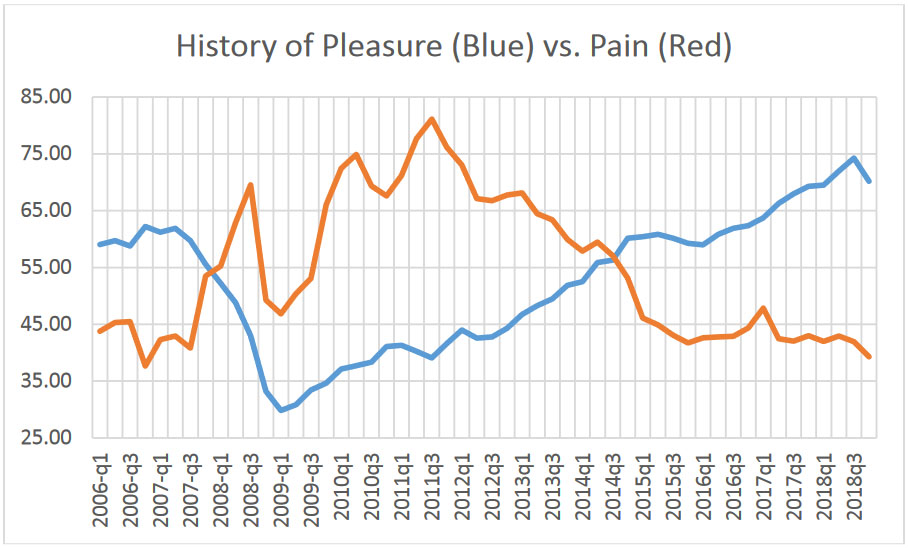
(Taken from the summary doc of Q4, 2018)
What exactly are these Pleasure and Pain indices comprised of?
I’m glad you asked :)
The Pleasure index is made of:
- The PFS 750 Market Index – An AICPA proprietary stock index comprised of the 750 largest companies trading on the US Market excluding ADRs, mutual funds and ETFs, adjusted for inflation and per capita.
- The AICPA Outlook Index – This broad-based composite index captures the expectations of CEOs, CFOs, Controllers, and other CPA executives for the economy, and their plans for a breadth of indicators of economic activity within their own organizations.
- Real Home Equity per Capita – A calculation of the Market Value of Real Estate, Households and Nonprofit Organizations, less the Home Mortgage Liability.
- Job Openings per Capita – A calculation of total non-farm job openings, published by the Bureau of Labor Statistics, divided by the Civilian Non-institutional Population.
And the Pain index is made up of:
- Inflation – Comprised of 95 percent annual change in the Personal Consumption Expenditures Price Index and 5 percent annual change in the Consumer Price Index for Fuel Oil and Other Fuels, as published by the BLS.
- Personal Taxes – This factor uses Bureau of Labor Statistics statistics on income tax, tax on realized net capital gains, taxes on personal property, payments for motor vehicle licenses, and several miscellaneous taxes, licenses, and fees.
- Delinquencies on Loans – Taken from data published by the Board of Governors of the Federal Reserve System, this factor is calculated as 75 percent delinquency rate on single family residential mortgages and 25 percent the delinquency rate on all loans and all commercial banks.
- Underemployment – This BLS-calculated factor is a combination of full title total unemployed numbers, all marginally attached workers, and total number of workers employed part-time for economic reasons.
So basically, whether you have a job or not, how much home equity/debt you have, how your personal taxes are fairing, how the stock market is fairing, what inflation is looking like, and then what the expectations are of smarty pants’ in the financial world.
I guess I could have just stated that in the beginning and killed all the jargon, haha…
How does this affect any of us, and why should we care?
Well, you really shouldn’t care too much as we all know what comparing will do, but it will affect you in about 2.3 seconds when I ask you to come up with your *own* personal indices as soon as you finish reading this sentence ;)
Knowing how the “average American” is doing is fine, but we aren’t the average American here, nor do we strive to be! However we do always need to know where we stand in any moment in time, so today I challenge you to think about how this short list of variables is going in your own life, and then rank them from 1-10 depending on how well or not you think you’re doing.
We’ll call it the “Personal Financial Satisfaction Index of Number One” (PFSiONE), and then hope they don’t mind us borrowing it ;)
Here’s the list of the variables again below, but tweaked to be more applicable in a *personal* finance way. Copy/print it out, and then rank how well you’re doing with each! With 1 meaning “you’re drowning hard” and 10 meaning “you’re rockin’ it.” Then maybe make it a habit of filling in every future month or quarter and tracking progress?
The Personal Financial Satisfaction Index of Number One – January, 2018:
- Investments: ________
- Financial Outlook: ______
- Home Equity: _______
- Employment Status: _______
- Personal Inflation: _______
- Personal Taxes: ______
- Debts Owed: _______
- Career Potential: ______
- PFSiONE Total Score: ______
Results Key:
- 70+ // You’re on FIRE! (See what I did there?)
- 60+ // You’re a growing flame
- 50+ // You’re starting to flicker!
- 49 and under // You need to be re-lit, STAT.
If none of these factors apply to you, just put an “n/a” on the line and then do your best to gauge how it affects your results… I haven’t really thought out this results key too much, haha…
READY. SET. INDEX!
******
My personal results:
- Investments: ___8___ (up so far this month!)
- Financial Outlook: ___10___ (I’m eternally optimistic no matter what’s going on :))
- Home Equity: ___n/a___ (Renting and Relaxing!)
- Employment Status: ___10___ (fully employed unless this blog crashes!)
- Personal Inflation: ___8___ (gas is down, but hairspray costs are up 📈)
- Personal Taxes: ___7___ (can this ever be a 10??? ;))
- Debts Owed: ___10___ (100% debt-free!)
- Career Potential: ___6___ (Technically it’s 10, however I don’t plan on using my full potential anytime soon as I’m very much enjoying this simpler life of “just being a blogger” :))
- PFSiONE Total Score: 59 out of 70 – a solid “growing flame“.
Get blog posts automatically emailed to you!


I love this J! Such a great find! Gotta love us CPA’s :)
I give myself a 77:
Investments: 7 (doing ok, still keeping up with inflation since I retired but the last few months . . . )
Financial Outlook: 10 (expenses are running at 2% of spendable net worth)
Home Equity: 10 (100% equity)
Employment Status: 10 (barely funemployed)
Personal Inflation: 10 (hiking, biking and Pickleball are almost free)
Personal Taxes: 10 (only pay self employment and state tax, in the sweet spot on federal income tax)
Debts Owed: 10 (none)
Career Potential: 10 (I could still go back if I wanted to but can’t see wanting to)
PFSiONE Total Score: 77
Wow, feeling pretty good here!
Retirement life looks good on you :)
I got 55. Not too bad, but not too great either. I’m just not feeling too optimistic this year. The shutdown, global economy, trade war, etc… There is a lot of bad news lately.
Investments: ____6____ (I’m not very optimistic this year. I just want to keep up with inflation.)
Financial Outlook: __8____ (Long term is good)
Home Equity: ___6____(Home equity is okay, we still have a mortgage.)
Employment Status: ___7____ (self employed, probably won’t make much $$ this year)
Personal Inflation: ___7____ (Not sure until we’re done with our move across town)
Personal Taxes: ___8___ (Pretty good. I don’t think we’ll owe anything this April)
Debts Owed: ___8____(Just the mortgage.)
Career Potential: __5____ (Not too optimistic about blogging in the future.)
PFSiONE Total Score: ___55___
Why not feeling optimistic about the blog stuff? More a personal thing or “the state of blogging” as a whole?
I give myself a 54.
Investments: 7. So far, mostly my apartment, which I consider an investment : scored for not too many €€, with excellent financing, and that I trust will resell well. I intend to move back home, where housing costs are WAY lower, when I FIRE.
Financial Outlook: 9. I’d say 10, mostly thanks to the employment, but I need to consider the life partner factor.
Home Equity: 0. Bahh. I haven’t even begun my mortgage (buying new, currently watching the building grow, renting until it’s done.)
Employment Status: 10. Government job, well paid, can’t be laid off.
Personal Inflation: 5. I’m part-time for the year, so all spending seems bigger in comparison. But I’ve cut expenses back.
Personal Taxes: 9. Going part-time allows me to decrease my tax vs income ratio.
Debts Owed: 6. Mortgage only, but I have yet to begin to pay it back.
Career Potential: 8. Never gonna make a fortune but the salary will be steadily growing in the next 16 years. I hope to FIRE in 20, so good enough for me.
Slow and steady win the race :) And I’m guessing where you live the gov’t doesn’t shut down every year or so like ours does here? Ugh…
You guess right, and you can believe I thank my lucky stars for that. I heard there might be some sort of temporary unfreeze for yours… hope your wife can start soon!
Maybe I should dock a point though, to take into account the possibility that our beloved overlords here get ideas.
Yup – it’s re-opened up here!!! And my wife actually just started a *newer* job in an agency that’s not affected by future shutdowns thank goodness.. such a mess, and an embarrassing one at that for our country.